
.png)
.png)

.png)
Features for Every Market
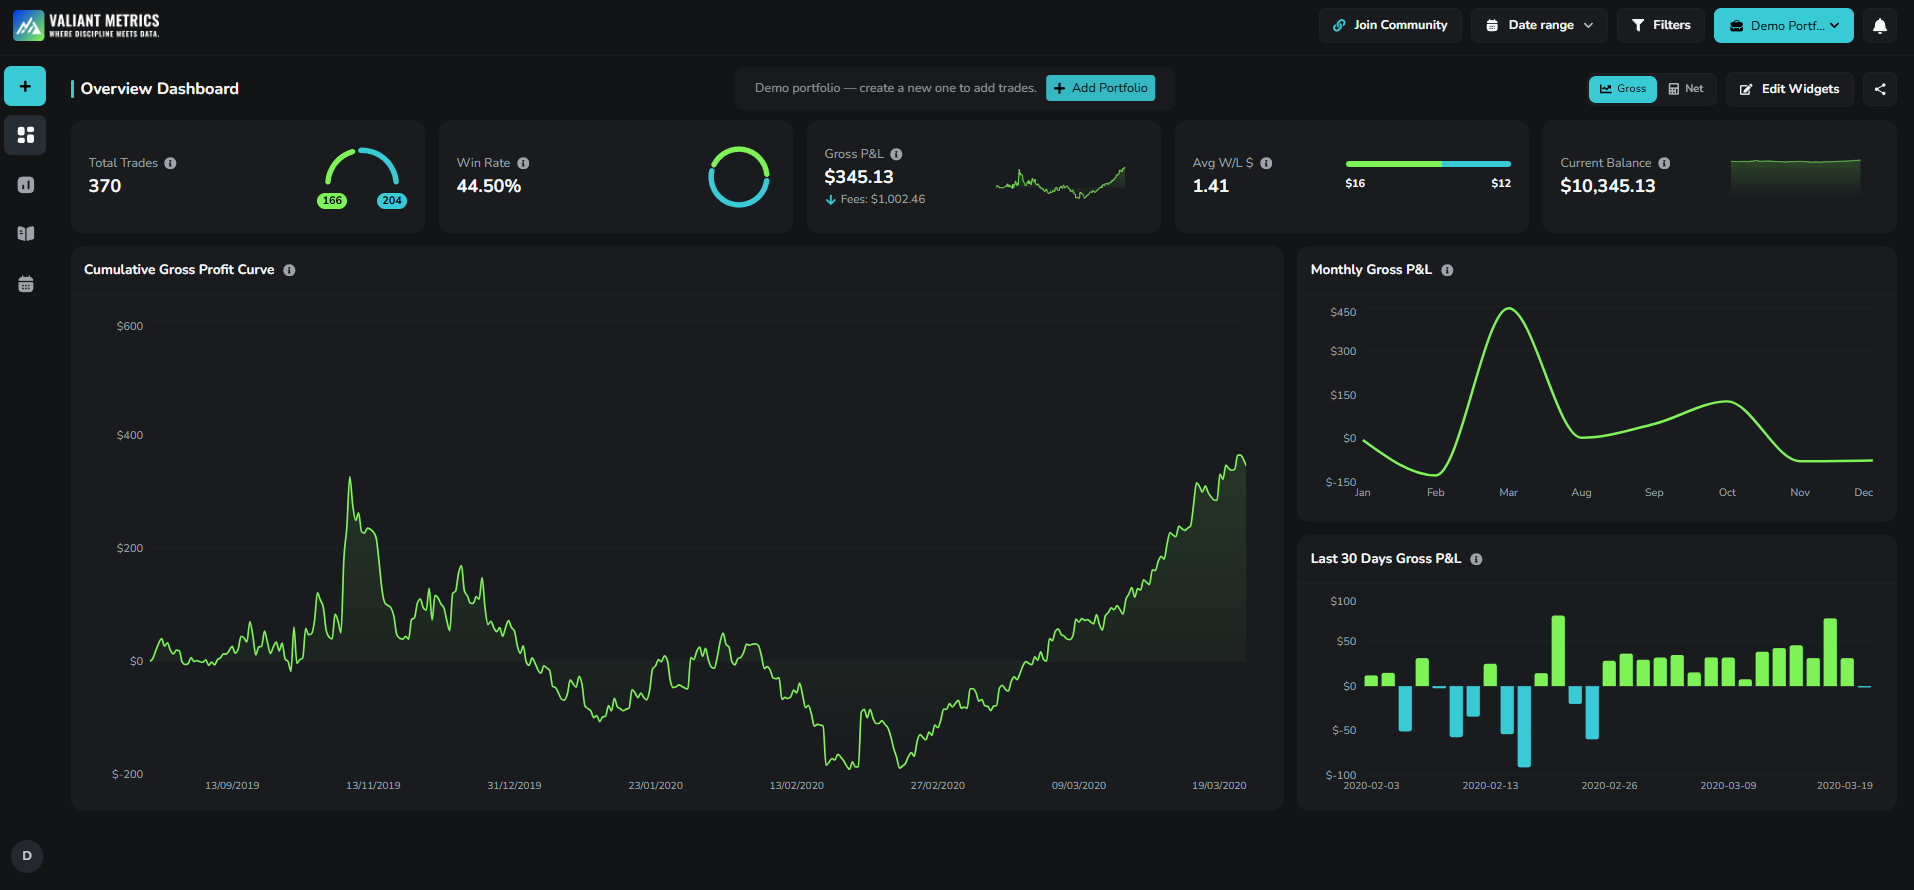
Overview Dashboard
See your essential metrics in one glance.
Track PnL, win rate, profit factor, total volume, and more.
Visualize consistency with automated summaries.
Identify performance trends without manual calculations
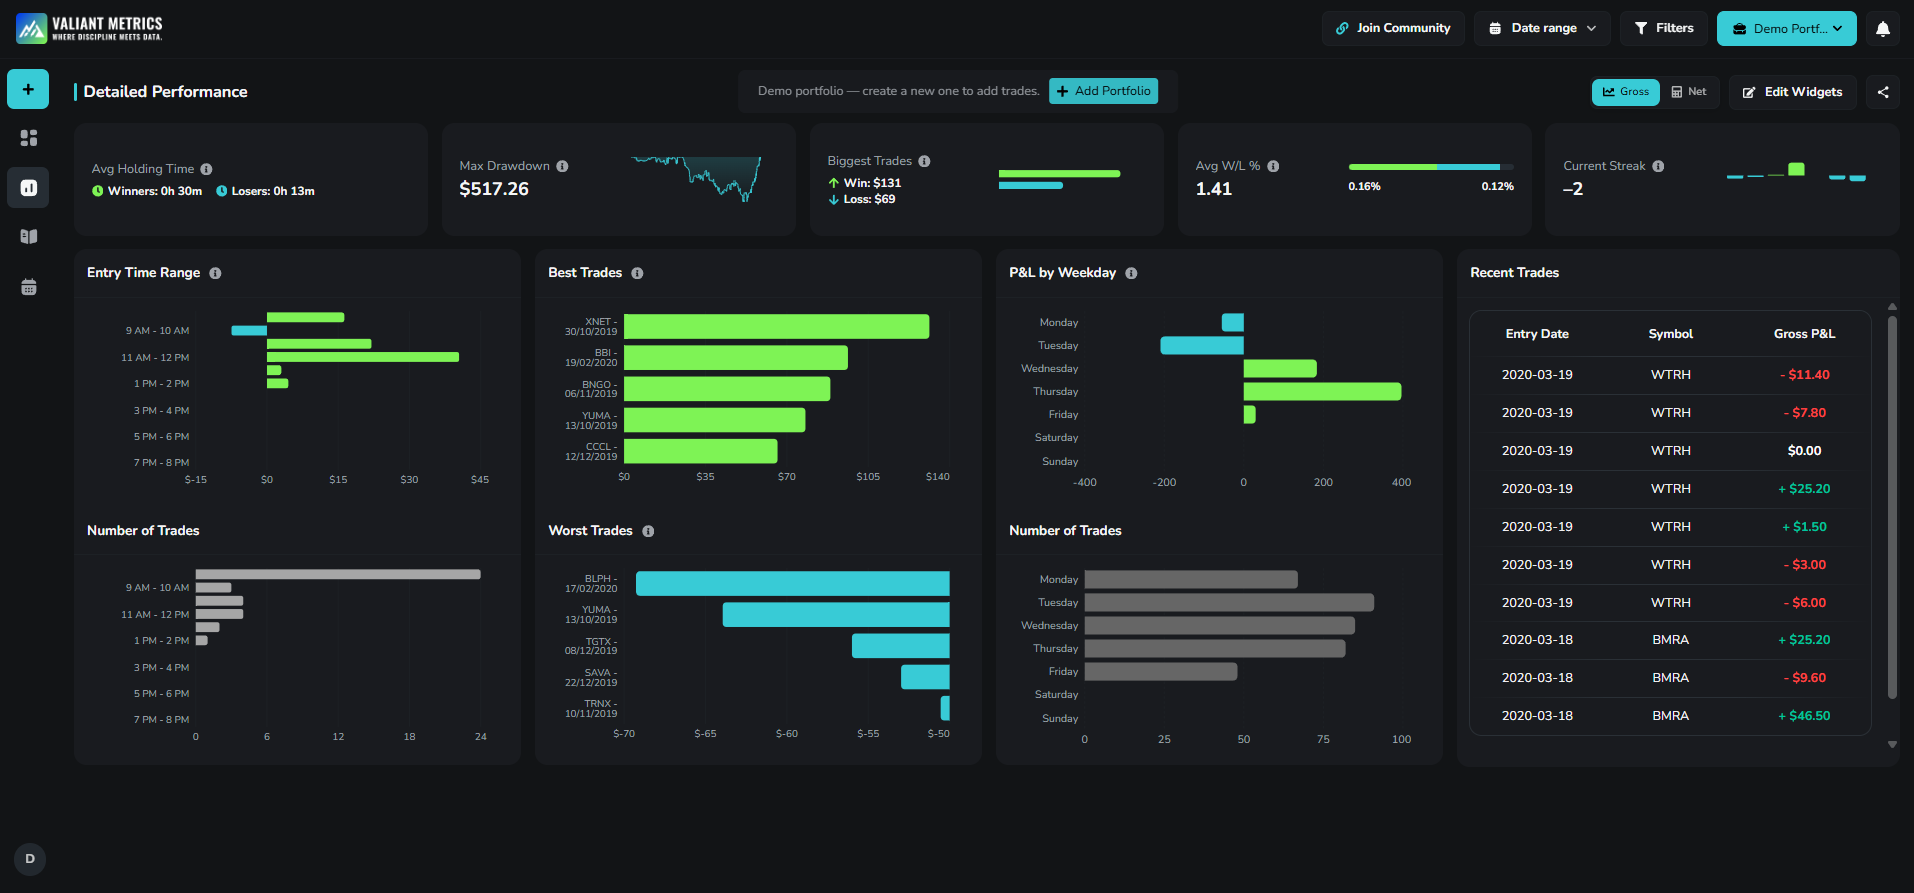
Detailed Performance
Dive deeper into your trading behavior and patterns.
Analyze performance by day, session, trade duration, and more.
Compare setups or instruments to find your edge.
Discover what trading conditions deliver your best (and worst) results.
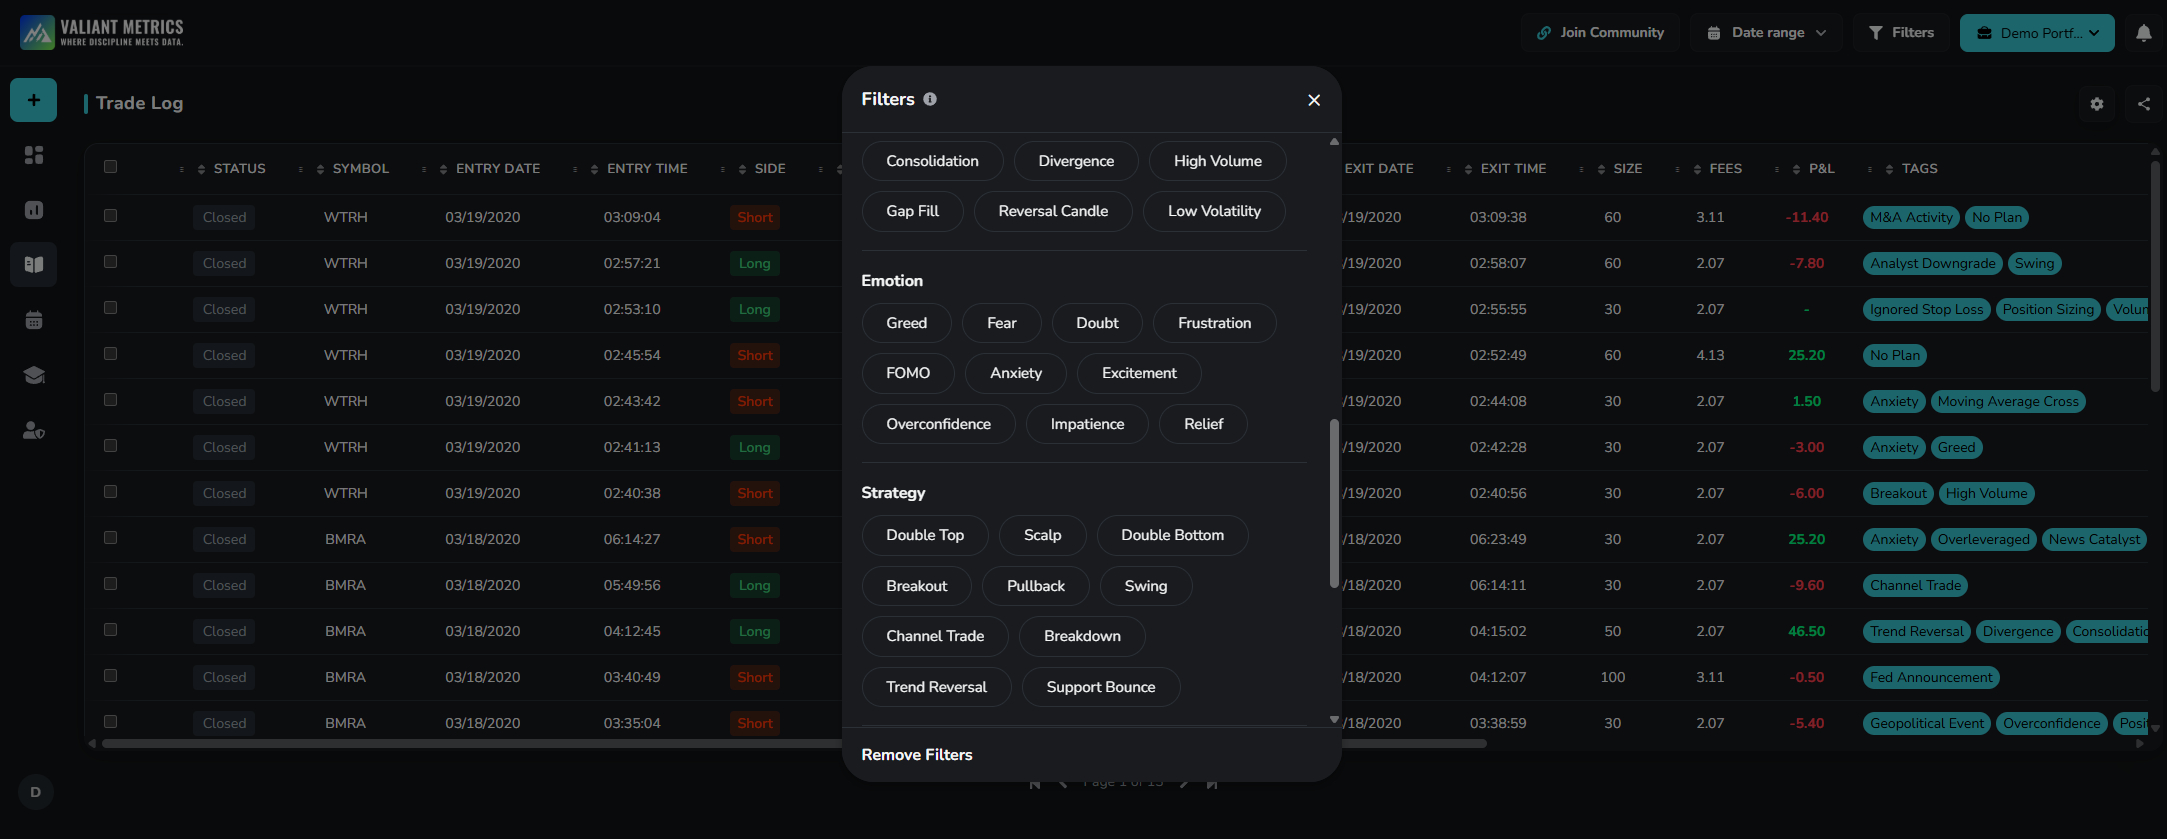
Trade Log
Log every trade with precision and automation for deeper analysis.
Record entries, exits, position size, and tags for deeper insights.
View chart executions, add notes, and review your thought process.
Instantly sync trades from your supported brokerage.


Trading Calendar
Visualize your trading history at a glance.
View daily, weekly, and monthly results in an interactive view.
Spot streaks, consistency, and areas for improvement.
Plan reviews or rest days based on performance rhythm.
Dynamic Filters
Customize your analysis the way you trade.
Combine filters by symbol, setup, direction, tag, and more.
Instantly isolate specific strategies, timeframes, and more.
Build repeatable insights that refine your edge.
Choose a Plan That Fits Your Trading Journey
$0
What’s included
Trade log with auto-import from brokers
Overview Section with basic stats
Manage up to 1 portfolio
Your data stays safe — upgrade or cancel anytime, hassle-free.
Limited support
$199
What’s included
Everything from the Free plan
Detailed analytics
Calendar view with daily summaries
Manage unlimited portfolios
Priority support
Access to new features and updates
$20
What’s included
Everything from the Free plan
Detailed analytics
Calendar view with daily summaries
Manage unlimited portfolios
Priority support
Access to new features and updates
Level Up Your Trading Game.
Try Valiant Metrics™ free and see how data can sharpen your edge. No credit card required.